Thin trees within forests
-
Overall effectiveness category Awaiting assessment
-
Number of studies: 6
View assessment score
Hide assessment score
How is the evidence assessed?
-
Effectiveness
not assessed -
Certainty
not assessed -
Harms
not assessed
Study locations
Supporting evidence from individual studies
A replicated, randomized, controlled study in 1987–1997 in tropical forest in Amazonas, Brazil (Lima et al. 2001) found that after killing (‘girdling’) non-commercial tree species of >25 cm trunk diameter, density of one of three lizard species was reduced 12 years later compared to unmanaged areas. Twelve years after non-commercial trees were girdled, striped whiptail lizard Kentropyx calcarata density (1–3 lizards/plot) was reduced compared to in unmanaged areas (4–6 lizards/plot), but density was similar for giant ameiva Ameiva ameiva (girdled: 1–4 individuals/plot; no management: 0–5 individuals/plot) and black-spotted skink Mabuya nigropunctata (girdled: 0–1 individuals/plot; no management: 0–2 individuals/plot). In 1985, non-commercial trees >25 cm diameter at breast height were killed (‘girdled’, see original paper for details) in three forest plots (4 ha each). Lizards were surveyed in girdled plots and three 4 ha plots with no historical management on foot by walking six 200 x 20 m transects in each plot during daytime in August–October 1996 and July 1997. The maximum number of lizards counted/plot was used as a measure of density.
Study and other actions testedA replicated, randomized, controlled study in 2004–2006 in pine forests in South Carolina, USA (Todd & Andrews 2008) found that snake abundance was higher in thinned compared to clearcut forest. The number of snakes captured was higher after thinning (180 individuals) compared to clearcutting (80–102 individuals). Numbers of snakes captured in unharvested plots was 137. Four circular forest sites were divided into four plots and each plot was randomly assigned one of four treatments: 85% thinned, clearcut with coarse woody debris retained, clearcut with coarse woody debris removed and unharvested for >30 years. Logging was from February to April 2004. Reptiles were sampled using drift fences with pitfall traps. Traps were checked every 1–2 days from April 2004 to July 2006 except for August.
Study and other actions testedA replicated, randomized, controlled study in 2006–2007 in hardwood forests in North Carolina, USA (Matthews et al. 2010) found that overall reptile species richness and capture rates were similar in areas with tree thinning compared to unmanaged areas. Overall reptile richness and overall reptile, snake and turtle captures were similar after thinning by mechanical cutting (richness: 6–7 species/100 array nights, overall captures: 6 individuals/100 array nights, snakes: 1–2 individuals/100 array nights, turtles: 0 individuals/100 array nights) and no management (richness:6, overall captures: 7, snakes: 3–5, turtles: 0). Three plots each (10 ha) were managed with mechanical-cutting (using chainsaws to cut trees and understory, 2001–2002) or not managed. Reptiles were surveyed in May–August 2006 and 2007 using drift fences with pitfall traps (‘arrays’, 3/site).
Study and other actions testedA replicated, controlled, before-and-after study in 2005–2008 in mixed forest in Alabama, USA (Sutton et al. 2013) found no clear effects of thinning on the abundance of six reptile species when compared to areas that were left unmanaged. The abundance of all six species (eastern fence lizard Sceloporus undulatus, green anole Anolis carolinensis, little brown skink Scincella lateralis, five-lined skink Plestiodon fasciatus, copperhead Agkistrodon contortrix and eastern racer Coluber constrictor) remained similar following heavy and light thinning compared to unmanaged areas (see paper for individual species abundances). In 2005–2008, three 9 ha plots each were either lightly thinned (17 m2/ha tree retention), heavily thinned (11 m2/ha tree retention) or left unmanaged (9 plots in total). Reptiles were surveyed for 3–6 months before management began (564 total trap nights in April–August) and in the two years after management (3,132 total trap nights in March–September) using drift fences with pitfall traps. Individuals were marked before release.
Study and other actions testedA replicated, controlled study in 2014 in pine forest in Granada, Spain (Azor et al. 2015) found that thinning trees in commercial forest by 66% increased reptile abundance but not species richness compared to thinning by 50% or no thinning. Reptile abundance was greater in 66%-thinned forest (11 reptiles/plot) compared to 50%-thinned (3 reptiles/plot) or unthinned forest (3 reptiles/plot) but similar to reptile abundance in open landscape (9 reptiles/plot). Reptile species richness was similar in 66%-thinned (2 species/plot), 50%-thinned (1 species/plot) and unthinned forest (1 species/plot), but lower than species richness in open landscape (3 species/plot). In 2010, a pine plantation with 600 trees/ha was managed by thinning 66% and 50% of trees in 20–37 ha areas. Reptiles were surveyed using a visual encounter method along u-shaped line transects in May-June 2014 in four plots each of 66% thinning, 50% thinning, as well as in four plots each with no tree thinning and in adjacent open landscape (all plots 100 x 35 m, 16 total plots). Each plot was surveyed four times at least five days apart.
Study and other actions testedA replicated, controlled study in 2015–2016 in pine and eucalypt woodland in north-west New South Wales, Australia (Gonsalves et al. 2018) found that reptile abundance and diversity were higher 8–20 years after tree thinning compared to <8 years or >20 years after thinning. Reptile abundance was 2–4.5 times greater and reptile diversity was 1.4–1.5 times greater 8–20 years after thinning than in unthinned, thinned <8 years ago, thinned >20 years ago or undisturbed forest (data reported as statistical model outputs, see original paper for details). In total 85 reptiles of 21 different species were caught across all sites (see original paper for changes in individual species abundances). The effect of tree thinning on reptiles was monitored in five 20–30 ha plots in 30 historically-managed forestry sites (non-commercial and commercial). Plots had the following thinning history: thinned <8 years ago using mechanical and manual brushcutting (thinnings left on site), thinned 8–20 years ago (larger stems for saw logs were removed from the site), thinned >20 years ago (thinnings left on site), unthinned (~6,500 stems/ha) and long undisturbed (see original paper for details). Reptiles were surveyed along a 200 m transect in each plot using nocturnal spotlighting (sampled once/plot, dates not provided) and drift fence/pitfall trap arrays (two traps/array, two arrays/plot) in October–November 2015 (eight days) and March 2016 (four days).
Study and other actions tested
Where has this evidence come from?
List of journals searched by synopsis
All the journals searched for all synopses
This Action forms part of the Action Synopsis:
Reptile Conservation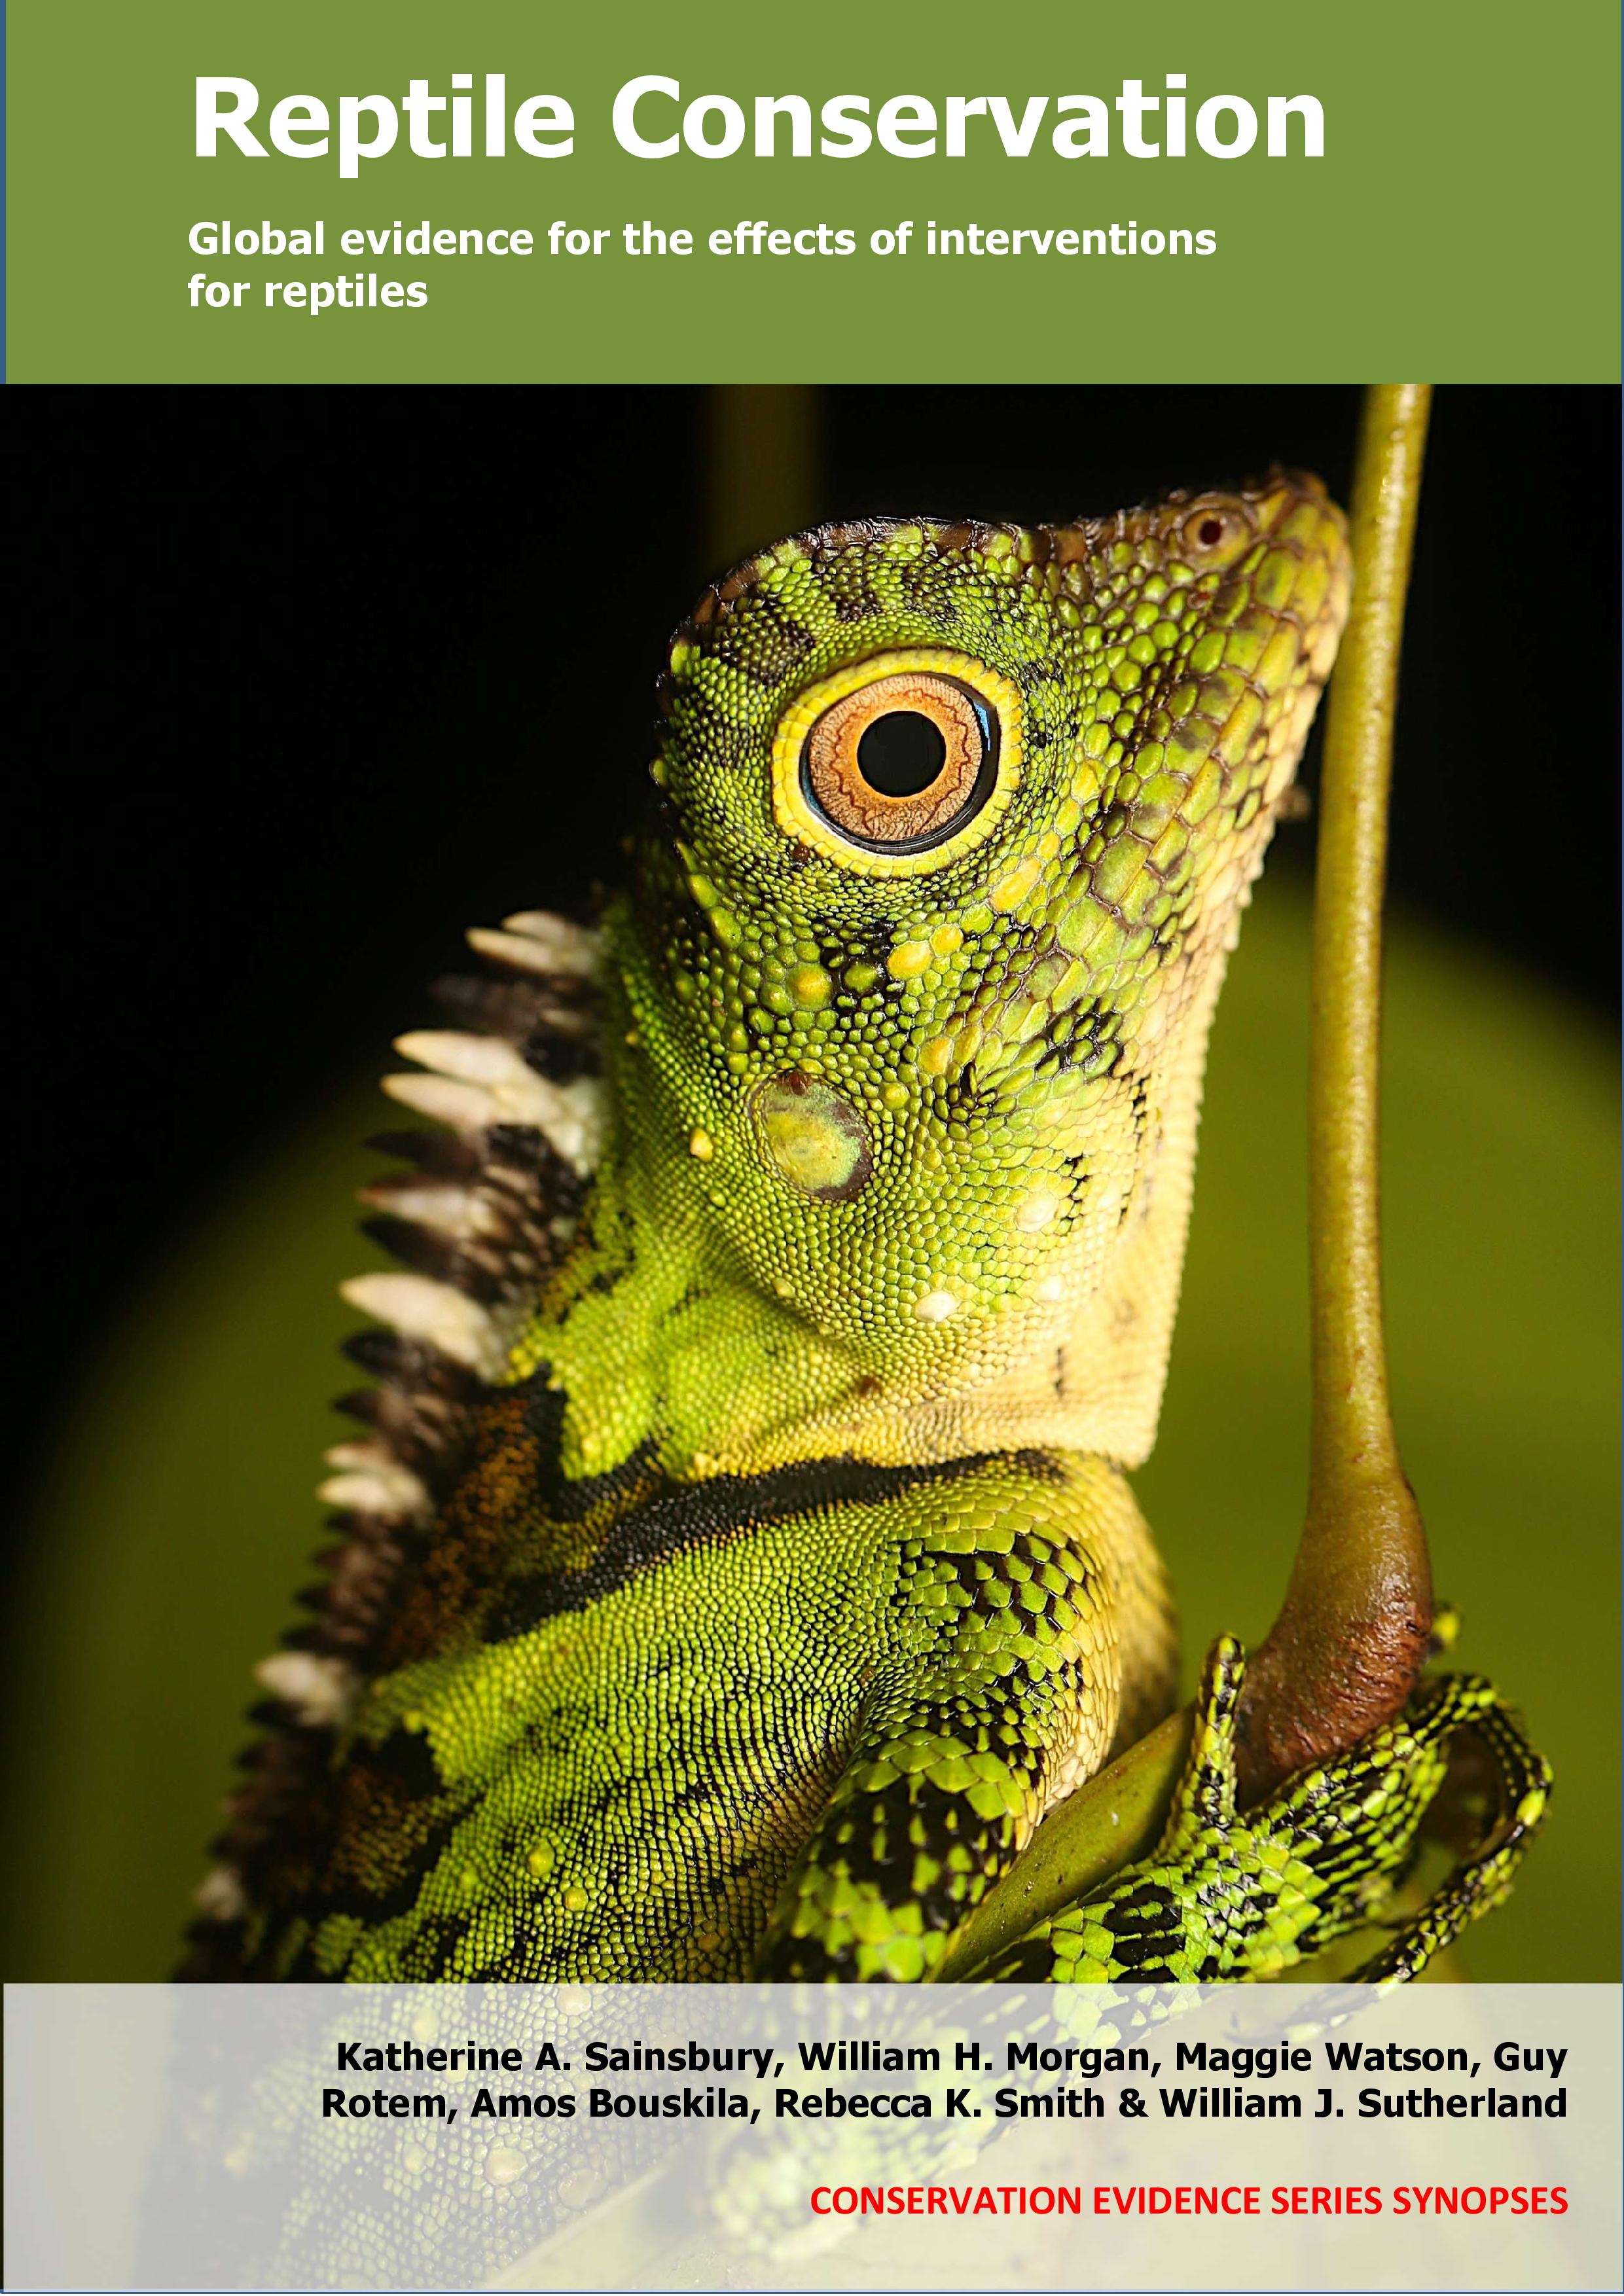
Reptile Conservation - Published 2021
Reptile synopsis



)_2023.JPG)


