Reprofile/relandscape: freshwater marshes
-
Overall effectiveness category Likely to be beneficial
-
Number of studies: 13
View assessment score
Hide assessment score
How is the evidence assessed?
-
Effectiveness
60% -
Certainty
55% -
Harms
10%
Study locations
Supporting evidence from individual studies
A study in 1982–1984 aiming to create a freshwater marsh on formerly mined land in Florida, USA (Erwin & Best 1985) reported that reprofiling (along with raising the water table) allowed marsh vegetation to develop within three months. Three months after intervention, 16 plant species were present with 33% total vegetation cover. After two years, 26 plant species were present with 75% total vegetation cover. During the second year after creation, the most abundant plant species were broadleaf cattail Typha latifolia (17–60% cover) and water pennywort Hydrocotyle sp. (17–35% cover). Methods: The study aimed to create a marsh on surface-mined land (historically a mix of forest and rangeland). In the early 1980s, a surface-mined area was landscaped to a gentle slope with shallow depressions. The water table was also raised by building a levee downslope. The study does not distinguish between the effects of these interventions. Some ponds were dug, but no wetland soil was added to this area. Interventions were completed in May 1982. Between autumn 1982 and summer 1984, the cover of every plant species was recorded along three randomly placed permanent transects (crossing zones of emergent and floating/submerged vegetation).
Study and other actions testedA replicated, site comparison study in 1988 of ten freshwater marshes in Connecticut, USA (Confer & Niering 1992) found that excavated marshes contained more open water and less vegetation cover than natural marshes, but similar richness of wetland plant species. After 4–5 years, the area of open water was greater in excavated marshes (5–90%) than in natural marshes (0–40%). Within vegetated areas, excavated marshes had only 71% vegetation cover on average (vs natural: 97%). Cover and frequency of individual species showed mixed results (see original paper for data; statistical significance not assessed). For example, broadleaf cattail Typha latifolia cover was lower in excavated than natural marshes in three of five comparisons, but higher in excavated than natural marshes in the other two comparisons. In contrast, tussock sedge Carex stricta always had similar or lower cover in excavated marshes compared to natural marshes. Finally, there was a statistically similar number of wetland plant species, on average, in excavated marshes (33 species/marsh) and natural marshes (30 species/marsh). Methods: In summer 1988, vegetation was surveyed in five created marshes (excavated in 1983–1984) and five nearby natural marshes. All marshes were <1 ha. Although paired geographically, created and natural marshes contained different soils and water levels. The total open water area was visually estimated. Plant species and their cover were recorded in at least forty 1-m2 quadrats/marsh, placed in vegetated areas. Some of the marshes in this study were also studied in (4).
Study and other actions testedA study in 1991–1992 of an excavated freshwater wetland in Pennsylvania, USA (Stauffer & Brooks 1997) reported that it developed vegetation cover, but mostly of upland plant species. After two growing seasons, there were 7 plant species/3 m2 in the excavated wetland. Vegetation cover was 45% and there were 86 plant stems/0.25 m2 (both higher, but not significantly, than after the first growing season). There was only 5% cover of wetland-characteristic plant species (vs 28% cover of species that usually grow in uplands). The overall plant community was more characteristic of upland than wetland conditions (data reported as a wetland indicator index). For data on the frequency of individual species, see original paper. Methods: In January 1991, a 1-m-deep basin was excavated in a formerly cropped floodplain. In the excavated wetland, the water table was 0.4–0.6 cm below the ground surface on average during the growing season. Vegetation was surveyed in August 1991 and 1992, in twelve 0.25-m2 quadrats in each of six 36-m2 plots.
Study and other actions testedA replicated, site comparison study in 1996 of seven freshwater marshes in Connecticut, USA (Moore et al. 1999) reported that created marshes had similar wetland plant richness, overall vegetation cover and woody plant cover to natural marshes, but greater cover of common reed Phragmites australis and cattails Typha spp. Statistical significance was not assessed. After 12–13 years, excavated marshes contained 25–53 wetland plant species (vs natural: 38–46 species) and had 80–123% total vegetation cover (natural: 90–130%). Key species with greater cover in created marshes included common reed (three of three comparisons; created: 2–29%; natural: <1%), narrowleaf cattail Typha angustifolia (three of three comparisons; <1–19%; natural: 0–11%) and broadleaf cattail Typha latifolia (two of three comparisons, for which created: 5–8%; natural: <1%). Woody plants had grown in both created marshes (10% cover) and natural marshes (16% cover). The study also reported data from 4–5 years after excavation (see original paper). Methods: In summer 1988 and 1996, vegetation was surveyed in four created marshes (excavated in 1983–1984) and three nearby natural marshes. All marshes were <1 ha, and the summer water table was 30 cm below to 22 cm above ground surface on average. Plant species and their cover were recorded in at least forty 1-m2 quadrats within vegetated areas of each marsh. This study used a subset of the marshes in (2).
Study and other actions testedA before-and-after, site comparison study in 1983–1999 of two marshes within a cut-off meander in France (Combroux et al. 2002) reported that after one marsh was reprofiled and isolated from the river channel, its plant community composition changed and species richness increased. Statistical significance was not assessed. Community data were reported as graphical analyses, species abundance scores and statistical model results. Over the 12 years before intervention, both marshes were developing cover of few, dominant plant species. The plant community composition was becoming less variable across each marsh and the number of plant species was declining (e.g. to 17 species in one marsh in 1997). In the year after intervention, plant community variation had increased across the reprofiled marsh, but remained relatively stable in the unmanaged marsh. Excavated areas of the reprofiled marsh developed a different plant community (dominated by invasive Nuttall’s pondweed Elodea nutallii) to areas of the marsh where sediment had been added (dominated by emergent species). In the two summers after intervention, the reprofiled marsh contained 20 and 21 plant species. Methods: The study used a meander that was cut off from its river at one end. In June 1998, one section still joined the river (and thus drained when the river level dropped in the summer) was reprofiled to maintain water levels. Excess silt was removed, and one end was plugged to isolate the section from the river channel. Another section of the meander (naturally isolated from the river) was not reprofiled and was used as a reference. Plant species and their abundance (combination of cover and patchiness) were recorded in summer before (1983, 1992, 1997) and after (1998, 1999) reprofiling, along 5–7 transects/marsh.
Study and other actions testedA replicated study in 1999–2001 of six excavated wetlands in Wyoming, USA (McKinstry & Anderson 2005) reported that no plants grew in the wetlands within two years of excavation. Methods: In late 1999, six wetlands were excavated (area: 0.25–1 ha; depth: <3 m) in bentonite clay soils. None of these marshes were amended with wetland soils (cf. Section 12.26). In September 2000 and 2001, forty 0.25-m2 quadrats/wetland were surveyed for vegetation. Quadrats were placed along transects perpendicular to the shoreline, so had variable water depths.
Study and other actions testedA before-and-after, site comparison study in 1996–2008 aiming to restore a reedbed on farmland in England, UK (Booth & Ausden 2009) found that excavated wet basins (also planted with common reed Phragmites australis) contained a greater density of reeds but fewer plant species than a nearby natural reedbed. The restored area was initially drained farmland. Seven years after excavations finished, the restored area contained a greater density of live reeds (96 stems/m2) than the natural reedbed (63 stems/m2). There was no significant difference in the density of dead reeds (restored: 52; natural: 48 stems/m2). Although the restored area contained fewer plant species than the natural reedbed at a large scale (restored: 5; natural: 9 species/30 m2), both sites had the same species richness at a small scale (3 species/2 m2). Statistical significance of these richness results was not assessed. Methods: Between 1996 and 2001, three hundred hectares of wet basins were excavated in farmland. Over 250,000 common reed stems were planted into the basins by 2003. The study does not distinguish between the effects of excavation and planting on non-planted vegetation. In August 2008, reed stems and plant species and were recorded in thirty 2-m2 quadrats: 15 in the restoration area and 15 in a natural (never-farmed) reedbed.
Study and other actions testedA study in 1997–2006 of a levelled, irrigated and partially planted freshwater marsh in California, USA (Miller & Fujii 2010) reported that it developed vegetation dominated by emergent plants, including planted tule Schoenoplectus acutus – although vegetation cover and density depended on the water level. After 2–9 years, the shallower half of the site had 89–98% total vegetation cover. This included 77–81% cattail Typha spp., 11–19% tule and 0–5% submerged vegetation cover. Emergent vegetation density fluctuated between 49 and 76 stems/m2. The deeper half of the site had 77–100% total vegetation cover, including 38–58% cattail, 3–8% tule, and 10–46% submerged vegetation cover. Emergent vegetation density fluctuated between 44 and 59 stems/m2. Across the entire site, above-ground biomass of emergent vegetation was 1,630 g/m2 after 1–3 years (vs submerged, floating and algae combined: 389 g/m2) then fluctuated between 925 and 2,360 g/m2 for the following six years. Methods: In autumn 1997, a 0.6-ha area of farmland was levelled and lowered. Tule was planted into two 0.25-ha basins within the site. Shortly after planting, the fresh water was continuously piped into the site, flooding the basins with 25 cm and 55 cm of water respectively. The study does not distinguish between the effects of levelling, planting and irrigation on non-planted vegetation. All plants and algae were surveyed along transects, in summer/autumn, at least biennially between 1998 and 2006. Biomass was cut, dried and weighed (years 1–3) or estimated from plant height and diameter (years 4–9).
Study and other actions testedA replicated study in 2005–2006 of nine excavated depressions in formerly mined land in Texas, USA (Hart & Davis 2011) reported that they developed greater vegetation cover, species richness and biomass over time. Unless specified, statistical significance was not assessed. Vegetation was present in 35% of quadrats in the youngest marshes (0–2 years old), 60% of quadrats in intermediate marshes (7–8 years old) and 55% of quadrats sampled in the oldest marshes (17–18 years old). The oldest marshes contained 8–11 plant species, all of which were wetland-characteristic species. The intermediate marshes contained 7–9 species (5–9 wetland-characteristic) and the youngest marshes contained 3–8 species (2–8 wetland-characteristic). For data on the frequency of individual species, see original paper. Averaged over a year, above-ground vegetation biomass was significantly greater in the oldest marshes than the intermediate or youngest marshes (data not reported). Methods: In 2005–2006, vegetation was surveyed in nine marshes (1–23 ha; three young, three intermediate and three old) excavated in a historically mined area. The oldest marshes were excavated in 1987. Some upland species had been planted around the youngest marshes. Emergent and submerged plants were identified and counted in nine 0.25-m2 quadrats/marsh/season, then live vegetation was cut, dried and weighed.
Study and other actions testedA replicated, site comparison study in 2011 of 27 freshwater marshes in Minnesota, USA (Fuselier et al. 2012) reported that excavated marshes typically had lower bryophyte species richness, frequency and biomass than natural marshes. Unless specified, statistical significance was not assessed. Excavated marshes were 2–15 years old. They contained 1–9 bryophyte species in total (vs natural marshes: 8–12), 1.6–3.2 bryophyte species/0.36 m2 (vs natural: 3.3; significantly lower in one of two comparisons) and 0.3–0.6 bryophyte species/0.36 m2 in the wettest areas (vs natural: 0.8). In excavated marshes, bryophytes occurred in 7–41% of sampled 100-cm2 quadrats (vs natural: 20–55%) and bryophyte biomass was <1–4 g/100 cm2 (vs natural: 2–5%). For data on the frequency of individual species, see original paper. Methods: In summer 2011, aquatic and semi-aquatic bryophytes were surveyed in 27 marshes: 18 excavated and nine natural. The natural marshes had burned in spring 2009 or 2011. Bryophyte species were recorded across the whole of each marsh and in twenty-four 0.36-m2 quadrats/marsh (placed along four transects from wetland to upland areas). All bryophytes were collected from twenty 100-cm2 quadrats in three excavated marshes and one natural, then dried and weighed.
Study and other actions testedA replicated, site comparison study in 2008–2009 involving 12 reprofiled ephemeral freshwater marshes (playas) in Nebraska, USA (Beas et al. 2013) found that reprofiled marshes typically had similar plant species richness to natural marshes after 1–11 years and greater species richness than degraded marshes, but reported different plant communities under each treatment. In two of two years, reprofiled marshes contained a similar number of plant species (overall: 43–49; native: 36–38 species/marsh) to natural marshes (overall: 38–40; native: 31 species/marsh). Reprofiled marshes contained significantly more plant species than degraded marshes (overall: 24–26; native: 18–19 species/marsh). However, reprofiled marshes were developing a plant community distinct from, rather than intermediate between, natural and degraded marshes (data reported as graphical analyses; statistical significance of differences not assessed). For example, reprofiled marshes contained mostly mudflat annual plants, rather than the wet prairie and perennial species present in natural marshes. Methods: In summer 2008 and 2009, vegetation was surveyed in 34 playa wetlands: 11–12 reprofiled (by removing excess upland sediment to create a graded basin; surrounded by crops or grassland), 11–12 degraded (with excess upland sediment; surrounded by and/or planted with crops) and 11–12 natural (unaffected by sediment; surrounded by grassland). Each June, July and August, plant species and their cover were recorded at 400 points across two transects/marsh. This study largely used the same marshes as (12).
Study and other actions testedA replicated, site comparison study in 2008–2009 involving 11 reprofiled ephemeral freshwater marshes (playas) in Nebraska, USA (Beas et al. 2014) found that reprofiled marshes had similar emergent vegetation cover, after 2–11 years, to both degraded and natural playas. In two of two years, emergent vegetation cover did not significantly differ between reprofiled marshes (74–95%), degraded marshes (81–91%) and natural marshes (85–96%). Methods: In June 2008, vegetation cover was recorded in 34 playa marshes (two transects/marsh). Of the marshes, 11 were reprofiled (by removing excess upland sediment to create a graded basin; surrounded by crops or grassland), 11 were degraded (with excess upland sediment; surrounded by and/or planted with crops) and 12 were natural (unaffected by sediment; surrounded by grassland). Surveys were repeated in 32 of the playas in June 2009. This study largely used the same marshes as (11).
Study and other actions testedA study in 2005–2013 of an excavated, planted and harvested water treatment marsh in Sardinia, Italy (De Martis et al. 2016) reported that it supported 275 plant taxa. This included 201 plant species in 161 genera. Approximately 63% of the taxa were Mediterranean (found predominantly or solely in this region) and approximately 16% were known non-natives in Italy. As expected in the study area, 56% of the taxa were annual plants that complete their life cycle rapidly in favourable conditions (“thereophytes”). Only 2% of taxa had underwater resting buds (“hydrophytes”). Methods: Between 2005 and 2013, plant taxa were recorded in the 37-ha EcoSistema Filtro marsh, which had been constructed with the dual aims of habitat creation and water treatment. There were monthly surveys (a) across the whole site, including banks and upland areas, and (b) in three 16-m2 plots, each April–July and September–December. The wetland had been constructed by excavating basins of varying salinity and levees (including removal of all existing vegetation; beginning 1990) and planting bundles of 2-m-tall common reed Phragmites australis (2004). Some “plant biomass” was mechanically removed between 2005 and 2007. Note that this study evaluates the combined effect of these interventions, and does not separate results from fresh, brackish and saline areas.
Study and other actions tested
Where has this evidence come from?
List of journals searched by synopsis
All the journals searched for all synopses
This Action forms part of the Action Synopsis:
Marsh and Swamp Conservation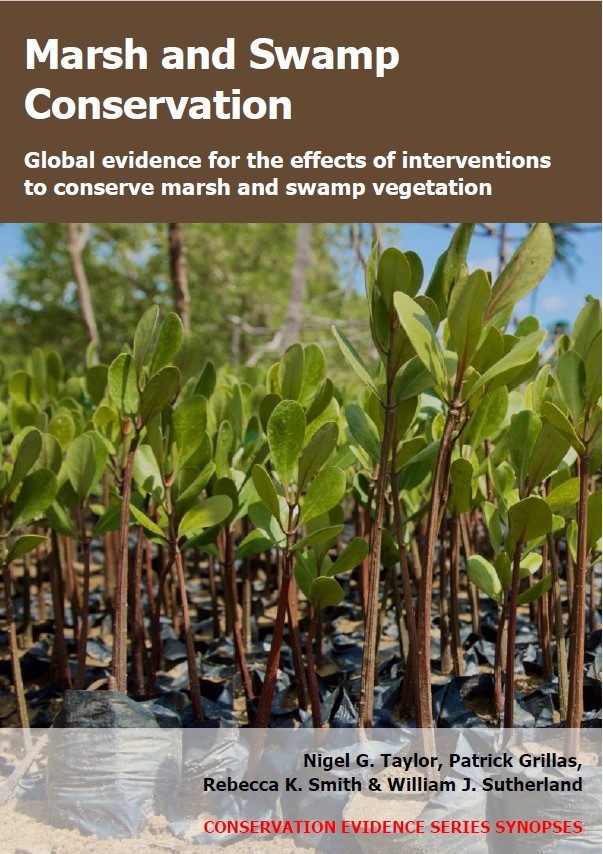
Marsh and Swamp Conservation - Published 2021
Marsh and Swamp Synopsis



)_2023.JPG)
